
A rental property can look attractive at first glance. The rent may seem high relative to the purchase price, the mortgage payment may appear manageable, and the property may be in an area with strong rental demand.
None of those factors, by themselves, tell you what the property is likely to produce financially.
A useful rental-property analysis starts with the property's income, accounts for vacancy and operating costs, measures its performance before financing, and then adds the specific loan and cash investment required to acquire it. From there, metrics such as cash flow, cap rate, cash-on-cash return, and debt-service coverage can be interpreted together.
The goal is not to find one number that labels a property a good or bad investment. It is to understand how the property works financially and which assumptions are driving the result.
Start With the Property's Income
The first step is estimating how much income the property can realistically produce. For a single-family rental, this may begin with monthly rent multiplied by 12. A duplex or other multifamily property requires adding the expected rent from each unit. Some properties may also generate recurring income from parking, laundry, storage, or other sources.
The important word is realistically.
If a property currently rents for $1,800 per month but you believe it could eventually rent for $2,100, those are two different assumptions. A projected rent increase may be reasonable, but it should not be treated as income the property already produces. You should also account for vacancy and collection loss. A property capable of producing $30,000 per year when fully occupied does not necessarily collect $30,000 every year.
For illustration, suppose the property has:
Monthly rent: $2,500
Annual potential rent: $30,000
If the analysis assumes 5% vacancy: $30,000 × 5% = $1,500 vacancy allowance
That leaves: $30,000 − $1,500 = $28,500 effective rental income
The 5% figure is only an example, not a universal vacancy standard. Actual vacancy can vary based on the market, property type, tenant turnover, management, lease structure, and other factors. The broader principle matters more than the percentage: potential income and expected collected income are not always the same thing.
Estimate the Operating Expenses
Once expected income is established, the next step is identifying the costs required to operate the property. Depending on the property, operating expenses may include:
-Property taxes
-Property insurance
-Property management
-Routine repairs and maintenance
-Owner-paid utilities
-HOA dues
-Landscaping
-Snow removal
-Pest control
-Other recurring property expenses
One of the easiest mistakes to make is comparing rent directly with the mortgage payment. If a property rents for $2,500 per month and the mortgage payment is $1,300, that does not automatically mean the property produces $1,200 of monthly cash flow. Taxes, insurance, vacancy, repairs, management, utilities, and other expenses may still need to be paid.
Capital expenditures also deserve separate consideration. Replacing a roof or HVAC system is different from paying for a routine repair. An investor may choose to model reserves for these larger future expenses even though reserves can be treated differently depending on the analytical, accounting, tax, or lending framework being used.
That is why a complete rental analysis should make its assumptions visible instead of hiding them inside one simplified expense percentage.

Calculate Net Operating Income
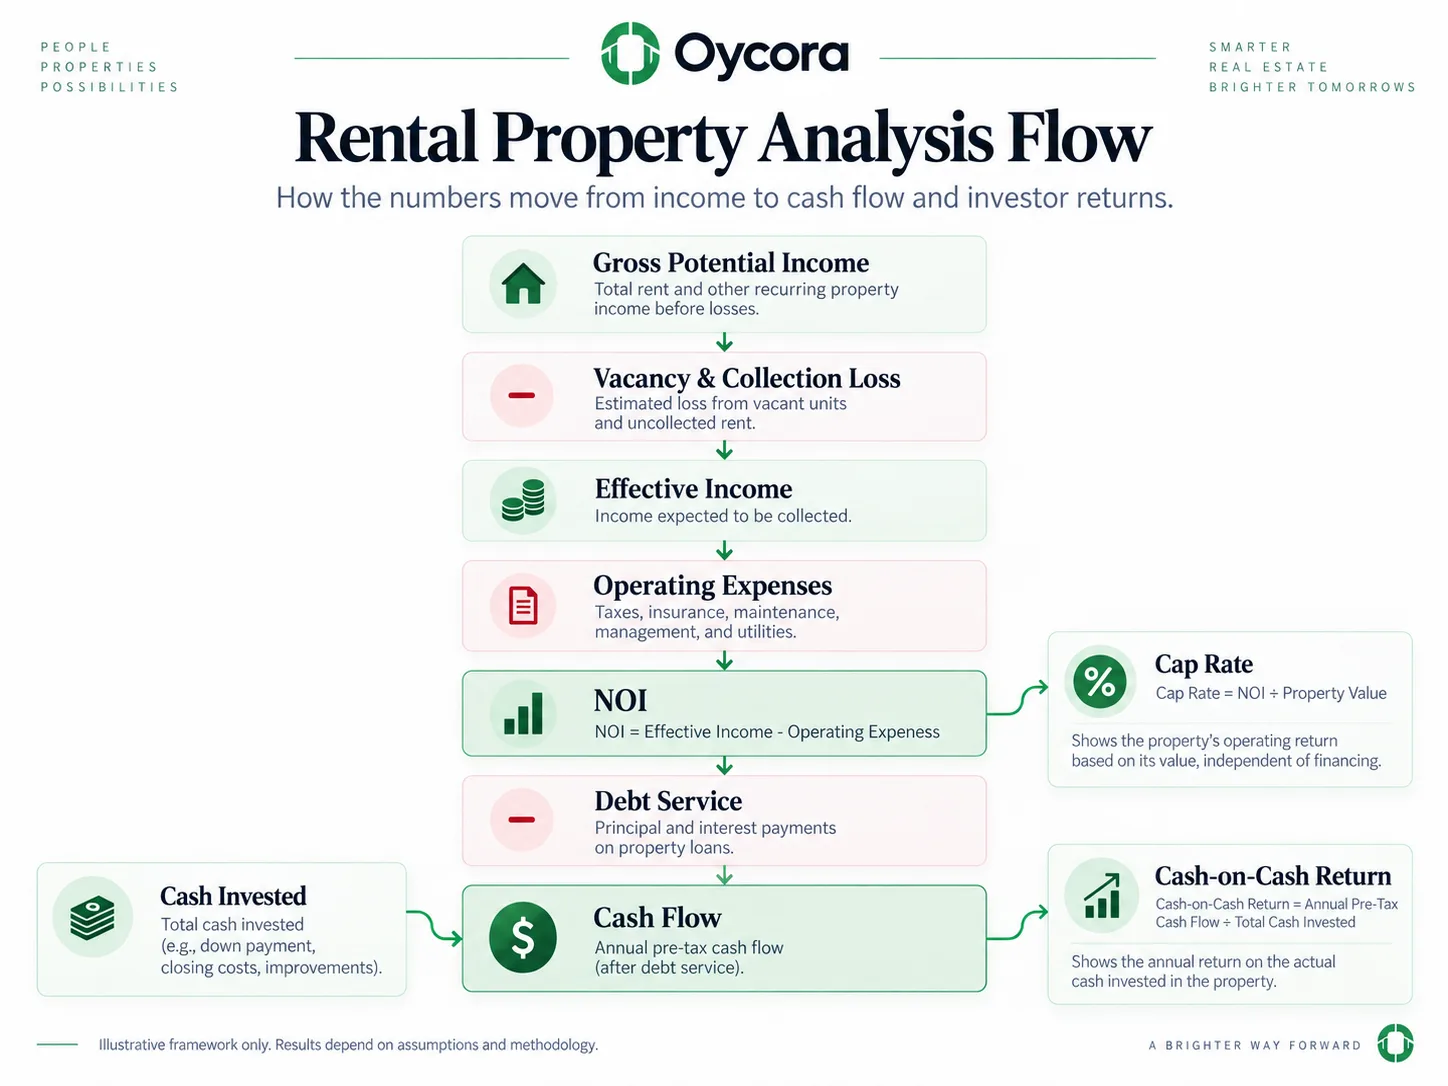
After estimating income and operating expenses, you can calculate net operating income, or NOI. A simplified formula is: NOI = Effective Property Income − Operating Expenses. NOI measures the property's operating performance before financing. That distinction is important.
Mortgage principal and interest are not deducted when calculating conventional NOI because financing depends on the individual buyer. Two investors can purchase the same property using completely different loan structures while the property's underlying operating performance remains the same.
Using our example, suppose the property produces $28,500 in effective annual income and has the following annual operating expenses:
Property taxes: $3,600
Insurance: $1,500
Property management: $2,280
Maintenance: $1,800
Owner-paid utilities and other expenses: $600
Total operating expenses: $9,780
NOI would therefore be: $28,500 − $9,780 = $18,720
That $18,720 describes the property's operating income before financing costs are considered. NOI also becomes the foundation for several other useful metrics, including cap rate and debt-service coverage.
Add Financing and Calculate Cash Flow
Once the property's operating performance is understood, financing can be added to the analysis. Relevant loan inputs may include:
-Down payment
-Loan amount
-Interest rate
-Loan term
-Amortization period
-Monthly principal and interest
-Total annual debt service
Suppose two investors purchase the same property for the same price. One puts 20% down while the other puts 40% down. The rent has not changed, the operating expenses have not changed. the NOI has not changed.
Their financing has.
That means the two investors can have the same NOI and cap rate while producing different cash flow and cash-on-cash returns. At a basic level: Pre-Tax Cash Flow = NOI − Debt Service. Depending on the analytical methodology, separately modeled reserves or other investor-level costs may also affect the final cash-flow figure.
Cash flow therefore answers a different question from NOI. NOI asks: How does the property perform operationally before financing? Cash flow asks: How much money remains after the financing structure and applicable modeled costs are included?
Use More Than One Metric
A complete rental-property analysis should not depend on one percentage. Different metrics measure different parts of the investment. Cap rate measures NOI relative to property value: Cap Rate = NOI ÷ Property Value
Because financing is excluded, cap rate helps evaluate the property's income-producing performance independently of how a specific investor chooses to finance it. Cash-on-cash return measures annual pre-tax cash flow relative to the investor's actual cash invested: Cash-on-Cash Return = Annual Pre-Tax Cash Flow ÷ Total Cash Invested
Unlike cap rate, cash-on-cash return is affected by financing. Changing the down payment, interest rate, loan amount, or other acquisition costs can change the result. Debt-service coverage ratio, or DSCR, compares NOI with the property's required debt service: DSCR = NOI ÷ Annual Debt Service
A DSCR above 1.00 means NOI exceeds the modeled debt service. A ratio below 1.00 means NOI alone does not fully cover it. Lenders may apply their own definitions, adjustments, and minimum requirements, so DSCR should not be treated as having one universal acceptable threshold.
And then there is cash flow, which tells you how much projected money remains after the costs included in the analysis. None of these metrics replaces the others. A property can have a strong cap rate but weak cash flow under expensive financing. Another property may produce modest current cash flow but require far less cash upfront. The numbers need to be interpreted together.
A Complete Rental Property Example
Now put the pieces together. Assume an investor is analyzing this fictional rental property:
-Purchase price: $240,000
-Monthly rent: $2,500
-Annual potential rent: $30,000
-Vacancy assumption: 5%
First, account for vacancy:
-$30,000 × 5% = $1,500
-$30,000 − $1,500 = $28,500 effective annual income
Next, subtract the annual operating expenses:
-Property taxes: $3,600
-Insurance: $1,500
-Management: $2,280
-Maintenance: $1,800
-Utilities and other expenses: $600
Total: $9,780
That produces: $28,500 − $9,780 = $18,720 NOI
At a $240,000 property value, the cap rate would be: $18,720 ÷ $240,000 = 7.8% Now add financing. Assume the investor makes a 20% down payment and uses a fictional 30-year mortgage at 7% interest:
-Down payment: $48,000
-Loan amount: $192,000
-Monthly principal and interest: approximately $1,277
-Annual debt service: approximately $15,329
Projected annual pre-tax cash flow becomes: $18,720 − $15,329 = $3,391
That is approximately: $283 per month
Now suppose the investor has $58,000 of total cash invested after including the down payment, assumed closing costs, and initial improvements. Cash-on-cash return would be approximately: $3,391 ÷ $58,000 = 5.8%
DSCR would be: $18,720 ÷ $15,329 = 1.22
Now the property can be viewed from several angles:
-NOI: $18,720
-Cap rate: 7.8%
-Annual cash flow: $3,391
-Monthly cash flow: approximately $283
-Cash-on-cash return: approximately 5.8%
-DSCR: approximately 1.22
None of these results automatically means the property is a good or bad investment. Together, however, they show what the property earns, what it costs to operate, how much financing affects the result, and how efficiently the investor's cash is being used.
Stress-Test the Analysis
A calculator can produce an exact answer from inaccurate assumptions. That is why a rental-property analysis should not end with the base case. Ask what happens if:
-Rent is slightly lower than expected
-Vacancy lasts longer
-Maintenance costs more
-Property taxes rise
-Insurance premiums increase
-A major component requires replacement
-Financing terms change
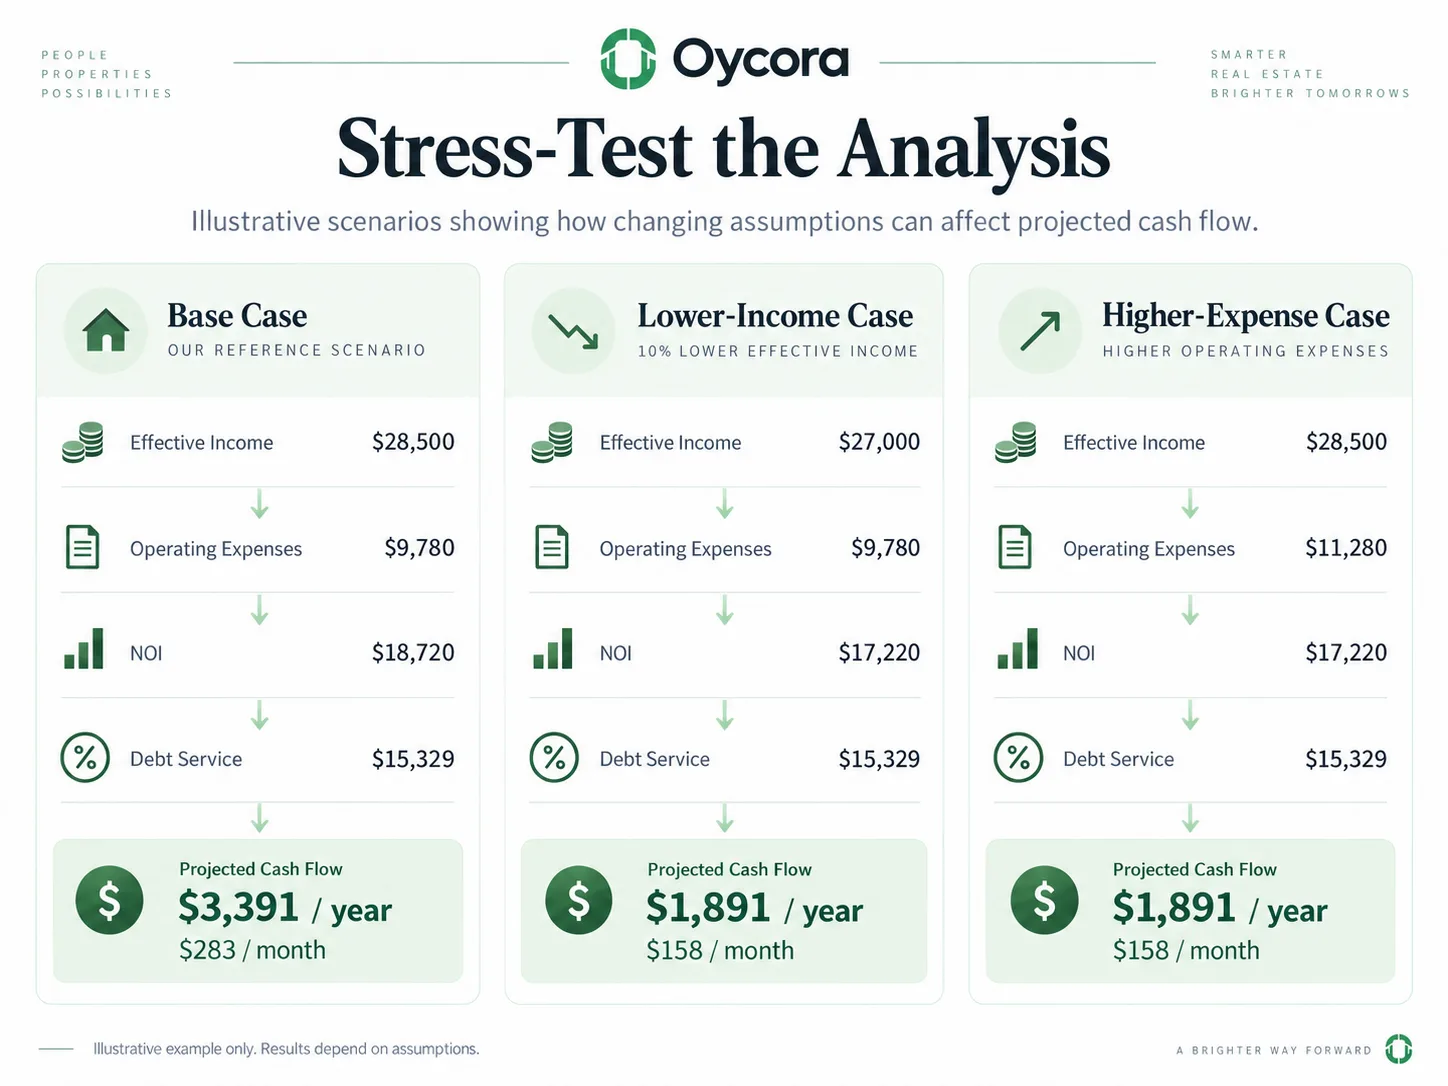
The purpose is not to predict every possible future expense. It is to understand how dependent the projected result is on the assumptions you entered. The example property above produces approximately $283 per month in projected pre-tax cash flow. If an unexpected expense costs several thousand dollars, that could consume much of a year's projected cash flow.
Likewise, slightly lower rent or higher expenses could materially change the result. A useful approach is to compare multiple scenarios:
-Base case: The assumptions you consider most reasonable.
-Conservative case: Lower income, higher expenses, or both.
-Alternative financing case: Different down payment, interest rate, or loan structure.
If a small change in one assumption dramatically changes the result, that is important information.
Put the Numbers Together Before Making a Decision
Rental-property analysis is not about finding one percentage that tells you whether to buy.
-Start with realistic income.
-Account for vacancy.
-Estimate the operating expenses.
-Calculate NOI.
Then add the financing structure to determine projected cash flow and investor-level returns. Finally, change the assumptions and see how stable the results remain. Financial analysis is also only one part of due diligence. Property condition, leases, local rental demand, taxes, insurance, financing terms, legal requirements, and other property-specific factors can all matter before an acquisition.
What the analysis gives you is a structured financial model.
It shows where the income comes from, where the money goes, how financing affects the outcome, and which assumptions matter most. The goal is not to predict the future perfectly. It is to understand what must happen for the property to perform the way your analysis says it will.