
Two investors can buy the same rental property and end up with very different returns on the cash they put into the deal.
One may make a large down payment and carry a relatively small mortgage. Another may use more leverage, keep more cash available, and take on a larger debt payment. The property's rent and operating expenses may be identical for both investors, but their financing changes both the cash flow they receive and the amount of money they invested upfront.
That is what cash-on-cash return is designed to measure.
The metric compares annual pre-tax cash flow with the investor's actual cash invested in the property. PropertyMetrics defines cash-on-cash return as cash flow before tax divided by total equity invested and notes that the metric specifically accounts for financing.
What Does Cash-on-Cash Return Measure?
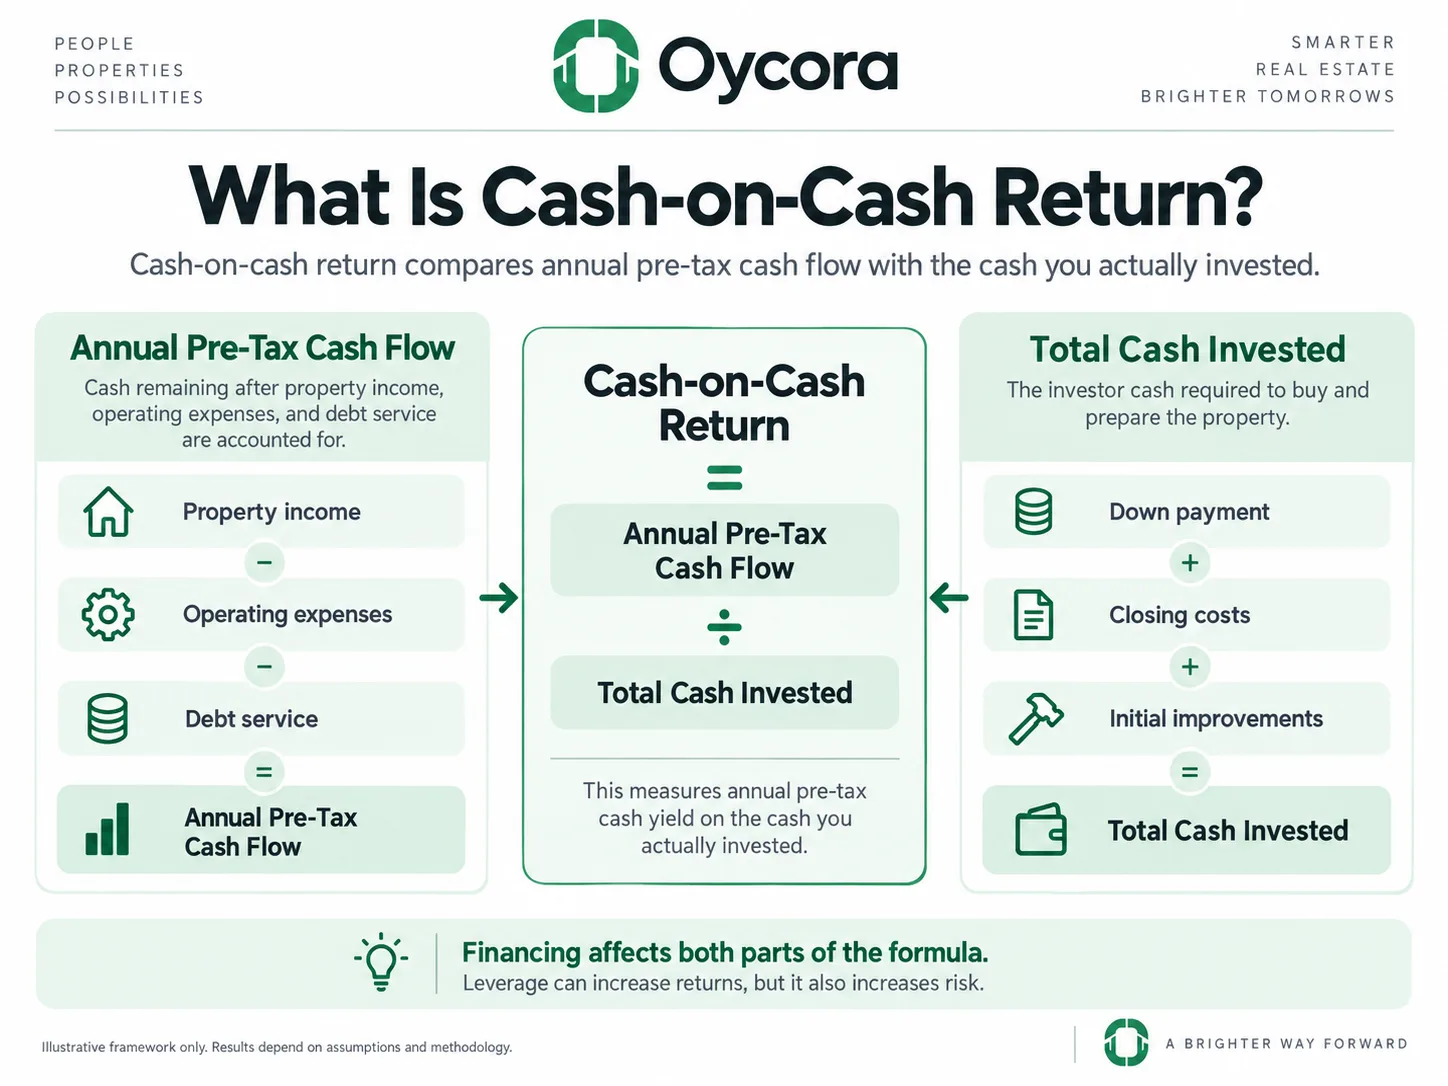
Cash-on-cash return measures the annual cash yield produced by the cash an investor has actually contributed to the property. The basic formula is:
Cash-on-Cash Return = Annual Pre-Tax Cash Flow ÷ Total Cash Invested
If an investor has $60,000 invested in a rental property and the property produces $6,000 in annual pre-tax cash flow, the cash-on-cash return is 10%.
The metric is useful because it incorporates the financing structure. Cap rate deliberately ignores financing and instead compares NOI with property value. Cash-on-cash return does the opposite: it looks specifically at the cash remaining after financing and compares that amount with the investor's cash contribution.
That means the same property can have one cap rate but several possible cash-on-cash returns depending on how the purchase is financed. What Counts as Annual Pre-Tax Cash Flow? The numerator in the cash-on-cash formula is generally the property's annual pre-tax cash flow. A simplified relationship is:
Annual Pre-Tax Cash Flow = NOI − Annual Debt Service
Depending on the analysis methodology, other separately modeled investor-level expenses or reserves may also affect the final cash-flow figure. The important point is that cash-on-cash return uses the cash that is expected to remain for the investor rather than the property's NOI by itself.
NOI and cash flow are not interchangeable. NOI represents property revenue minus operating expenses and excludes financing and capital costs. Nareit's current definition specifically excludes debt service from NOI. Suppose a property produces $24,000 in NOI but requires $16,800 in annual debt service. The simplified annual pre-tax cash flow would be $7,200. That $7,200, not the $24,000 NOI, is the figure used in the numerator of the cash-on-cash calculation.
This is what makes the metric sensitive to interest rates, loan amounts, amortization, and down payments.
What Counts as Total Cash Invested?
The denominator is the investor's total cash invested, sometimes described as equity invested.
For a straightforward rental acquisition, this may include the down payment, closing and transaction costs paid in cash, and initial improvements or repairs funded by the investor. PropertyMetrics describes total equity invested as the initial equity contribution plus transaction costs and any additional equity required during the holding period.
For a simple acquisition, that might look like:
- Down payment
- Buyer-paid closing costs
- Initial renovation or repair cash
- Other acquisition cash required to place the property into service
The exact treatment should remain consistent with the methodology being used. The important idea is that the denominator should represent the actual cash tied up in the investment, not the full property price when part of that price was financed.
If a $300,000 property is purchased with $60,000 down and $12,000 of other cash costs, the investor has not contributed $300,000 of cash. The starting cash investment is closer to $72,000 under those assumptions.
That distinction is why cash-on-cash return is particularly useful for leveraged real estate.
Calculating Cash-on-Cash Return
Consider a fictional rental property financed with debt. Assume the following:
| Item | Amount |
|---|---|
| Net operating income | $24,000 |
| Annual debt service | $16,800 |
| Annual pre-tax cash flow | $7,200 |
| Down payment | $50,000 |
| Closing costs and initial improvements | $10,000 |
| Total cash invested | $60,000 |
| Cash-on-cash return | 12.0% |
The calculation is:
$7,200 ÷ $60,000 = 0.12, or 12.0%
The property therefore produces $7,200 of projected annual pre-tax cash flow on $60,000 of investor cash under these assumptions.
Now imagine a second investor buys the same property with a much larger down payment. That investor may have lower annual debt service and therefore higher annual cash flow, but they also have substantially more cash tied up in the property.
| Financing Structure | Annual Pre-Tax Cash Flow | Total Cash Invested | Cash-on-Cash Return |
|---|---|---|---|
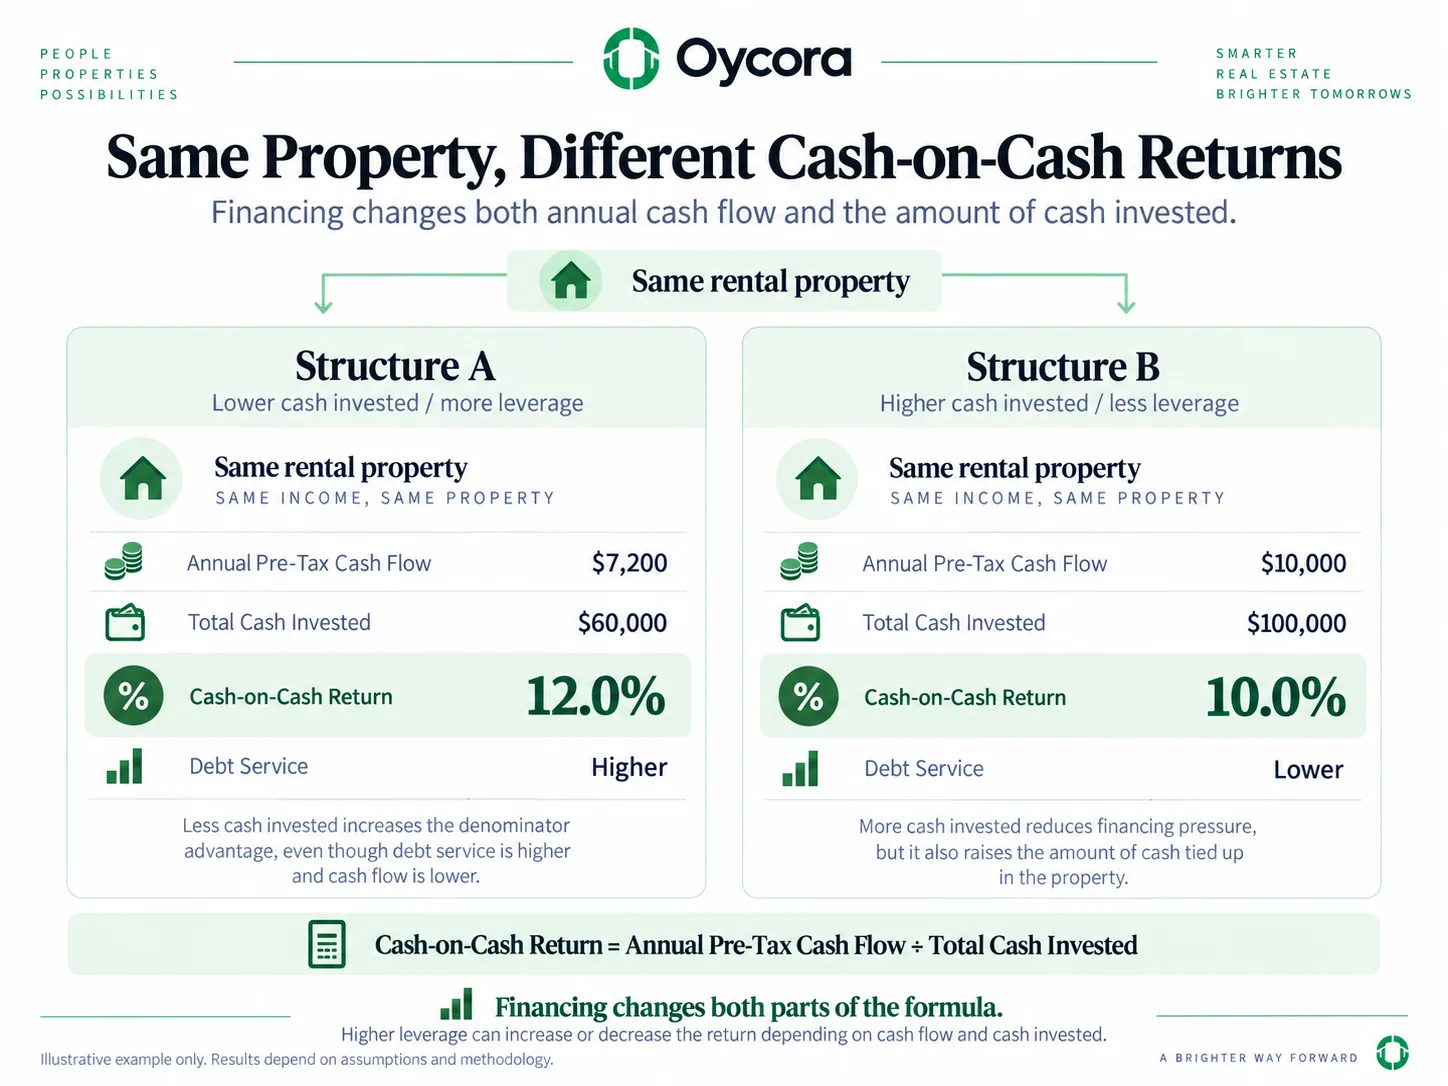
| Lower cash investment / more leverage | $7,200 | $60,000 | 12.0% |
| Higher cash investment / less leverage | $10,000 | $100,000 | 10.0% |
The second investor receives more annual cash flow in absolute dollars, yet the cash-on-cash return is lower because much more investor cash is committed to the property.
This is an important lesson: more cash flow does not automatically mean a higher cash-on-cash return.
How Financing Changes Cash-on-Cash Return
Cash-on-cash return is especially useful because leverage affects both sides of the calculation.
A smaller down payment reduces the amount of investor cash in the denominator, but it usually increases the loan balance and debt service, which can reduce cash flow in the numerator. A larger down payment usually does the opposite: it increases cash invested but reduces financing costs and may improve annual cash flow.
There is no rule that one structure will always produce the higher cash-on-cash return. The result depends on the loan terms, interest rate, purchase price, property income, operating expenses, and amount of cash invested.
Leverage can increase the cash-on-cash return when the reduction in cash invested outweighs the additional financing cost. It can also reduce the return if debt service becomes too expensive. This is why comparing financing scenarios is often more useful than assuming that either maximum leverage or maximum down payment is automatically best.
Is There a Good Cash-on-Cash Return?
There is no universal cash-on-cash return that automatically makes a rental property attractive. A 6% return may fit one investor's goals and be insufficient for another. A 12% return may look attractive but depend on aggressive leverage, optimistic rent assumptions, unusually low expenses, or substantial property risk.
Market conditions matter. Financing matters. Property condition matters. The investor's strategy, liquidity needs, risk tolerance, and alternative uses for the cash matter as well. A cash-on-cash return is best interpreted as a measurement, not a pass/fail threshold.
It tells you how much projected annual pre-tax cash flow the property is producing relative to the amount of cash committed under a particular financing structure. Whether that result is acceptable requires additional context.
Cash-on-Cash Return vs. Cap Rate
Cap rate and cash-on-cash return are often discussed together, but they answer different questions.
Cap Rate = NOI ÷ Property Value
Cash-on-Cash Return = Annual Pre-Tax Cash Flow ÷ Total Cash Invested
Cap rate ignores financing. Nareit defines it as NOI divided by current market value or purchase price and notes that financing and capital structure are not part of the metric. Cash-on-cash return specifically incorporates financing because debt service affects cash flow and the down payment affects cash invested.
Two investors purchasing the same property at the same price will generally calculate the same cap rate if they use the same NOI. Their cash-on-cash returns may be very different. Cap rate is therefore useful for evaluating the property's income relative to value. Cash-on-cash return is useful for evaluating the investor's cash yield under a specific capital structure. Neither replaces the other.
Cash-on-Cash Return vs. ROI
Cash-on-cash return is also narrower than total return on investment. It generally looks at one year's pre-tax cash flow relative to the cash invested. It does not automatically capture every way an investor may eventually make or lose money on the property.
For example, cash-on-cash return does not directly include appreciation, changes in property value, proceeds from a future sale, tax consequences, or the full long-term effect of mortgage principal paydown. PropertyMetrics similarly characterizes it as a cash-yield measure and notes that it does not capture appreciation or long-term cash flows.
An investor could therefore have a modest cash-on-cash return while also building equity through principal reduction or benefiting from appreciation. The reverse is also possible: a property might produce strong current cash flow while declining in value. Cash-on-cash return tells you about current cash yield, not total wealth creation over the entire holding period.
Common Cash-on-Cash Return Mistakes
One of the most common mistakes is using NOI in the numerator instead of pre-tax cash flow. That ignores financing and effectively turns the calculation into something closer to a property-level yield metric. Another mistake is forgetting part of the cash invested. Using only the down payment while ignoring closing costs, initial renovations, or other required cash can overstate the return.
Investors may also compare two cash-on-cash returns built from inconsistent assumptions. One property may use conservative maintenance and vacancy estimates while another uses optimistic projections. The percentages may look directly comparable even though the underlying models are not.
Another mistake is assuming a higher cash-on-cash return automatically means a better investment. More leverage can sometimes increase the percentage while also increasing debt obligations and reducing the property's margin for error. Finally, avoid treating the metric as a forecast of total investment return. It is a relatively narrow measure of annual cash performance.
Use Cash-on-Cash Return to Understand Your Capital
The strength of cash-on-cash return is that it connects the property's projected cash flow with the investor's actual capital. It tells you something cap rate cannot: how efficiently the cash you contributed is producing annual pre-tax cash flow under the financing structure you chose.
That makes it useful when comparing down-payment options, evaluating leveraged purchases, or comparing multiple rental opportunities competing for the same amount of investor cash.
But the metric should still sit inside a broader analysis. NOI, cap rate, debt coverage, property condition, financing risk, future capital needs, appreciation assumptions, and long-term return potential all provide information that cash-on-cash return leaves out. Use it for the question it actually answers, rather than asking one percentage to decide the entire investment.