
A rental property can build equity even when its market value stays unchanged. Each scheduled principal payment reduces the outstanding loan balance, increasing the owner’s share of the property’s value if everything else remains equal. That process can contribute to a long-term investment result, but it does not deposit extra money into the operating account.
Understanding mortgage amortization helps separate three numbers that are often mixed together: the payment leaving the bank account, the interest paid to borrow money, and the principal used to reduce debt. A useful analysis follows all three rather than treating the entire mortgage payment as either an expense or an investment gain.
What Mortgage Amortization Actually Means
Mortgage amortization is the scheduled repayment of a loan over time. On a fully amortizing fixed-rate loan, each regular principal-and-interest payment covers the interest due and repays part of the borrowed balance. If payments are made as scheduled, the balance reaches zero at the end of the amortization period.
The principal-and-interest amount normally stays level, while its composition changes. Interest is calculated on the remaining balance, so the interest portion declines as that balance falls. More of the same payment can then go toward principal. The Consumer Financial Protection Bureau explains this distinction in its mortgage repayment guidance; Freddie Mac illustrates it with an example amortization schedule.
This article uses that standard structure. An interest-only period, adjustable rate, balloon balance, missed payment, or loan modification changes the analysis. Before using a projection, confirm both the amortization period and the contractual maturity date. A loan modeled over 30 years can still require repayment or refinancing sooner if it matures before then.
Separate the Loan Payment From the Property’s Other Bills
The amount sent to a mortgage servicer may include more than principal and interest. Property taxes, insurance, and sometimes mortgage insurance can be collected alongside the loan payment. Those additional amounts do not reduce principal. They also may change even when the loan’s principal-and-interest payment is fixed.
For rental underwriting, keep debt service separate from operating expenses. Net operating income, or NOI, is calculated before mortgage principal and interest. Taxes and property insurance generally belong in the operating budget whether the owner pays them directly or through escrow. Deducting them inside NOI and then subtracting an escrow-inclusive payment would count the same costs twice.
The rental’s cash budget must still cover the full amount actually due. Separating categories is an accounting discipline, not permission to ignore a bill. Match the mortgage calculator’s payment definition to the cash-flow model before comparing results, and include any financing charges that the simplified principal-and-interest calculation leaves out.
Follow One Payment From Interest to Principal
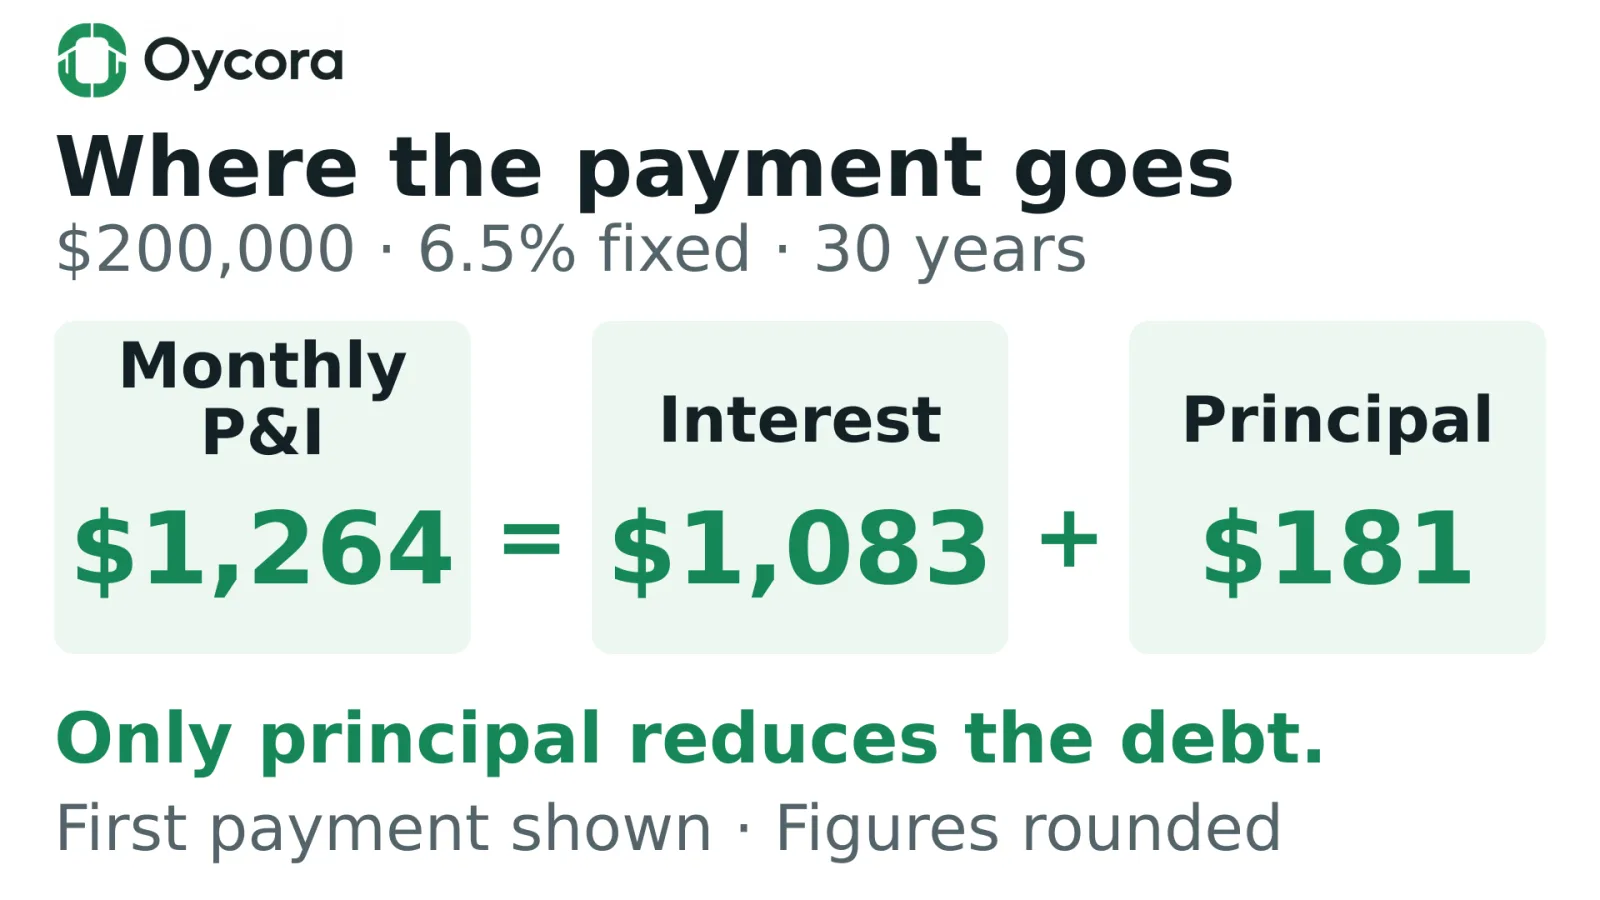
Assume a fictional $200,000 loan amortized over 30 years at a fixed annual interest rate of 6.5%, with monthly payments. The rate is an illustration, not a current offer or an expectation of what an investor will qualify for. The standard monthly principal-and-interest payment is approximately $1,264.14.
Using the annual rate divided by 12, first-month interest is $200,000 × 6.5% ÷ 12, or approximately $1,083.33. The remainder of the payment reduces principal by approximately $180.80. Calculations use unrounded amounts internally; displayed cents can produce a one-cent difference when subtracted. The next month begins with a slightly smaller balance and therefore slightly less interest.
After 12 scheduled payments, the modeled balance is approximately $197,764.55. Principal has fallen by $2,235.45, although the year’s principal-and-interest payments total approximately $15,169.63. Most of the first year’s payments went to interest. Looking only at the total paid would substantially overstate how much debt was retired.
Compare a 15-Year and 30-Year Loan on the Same Rental
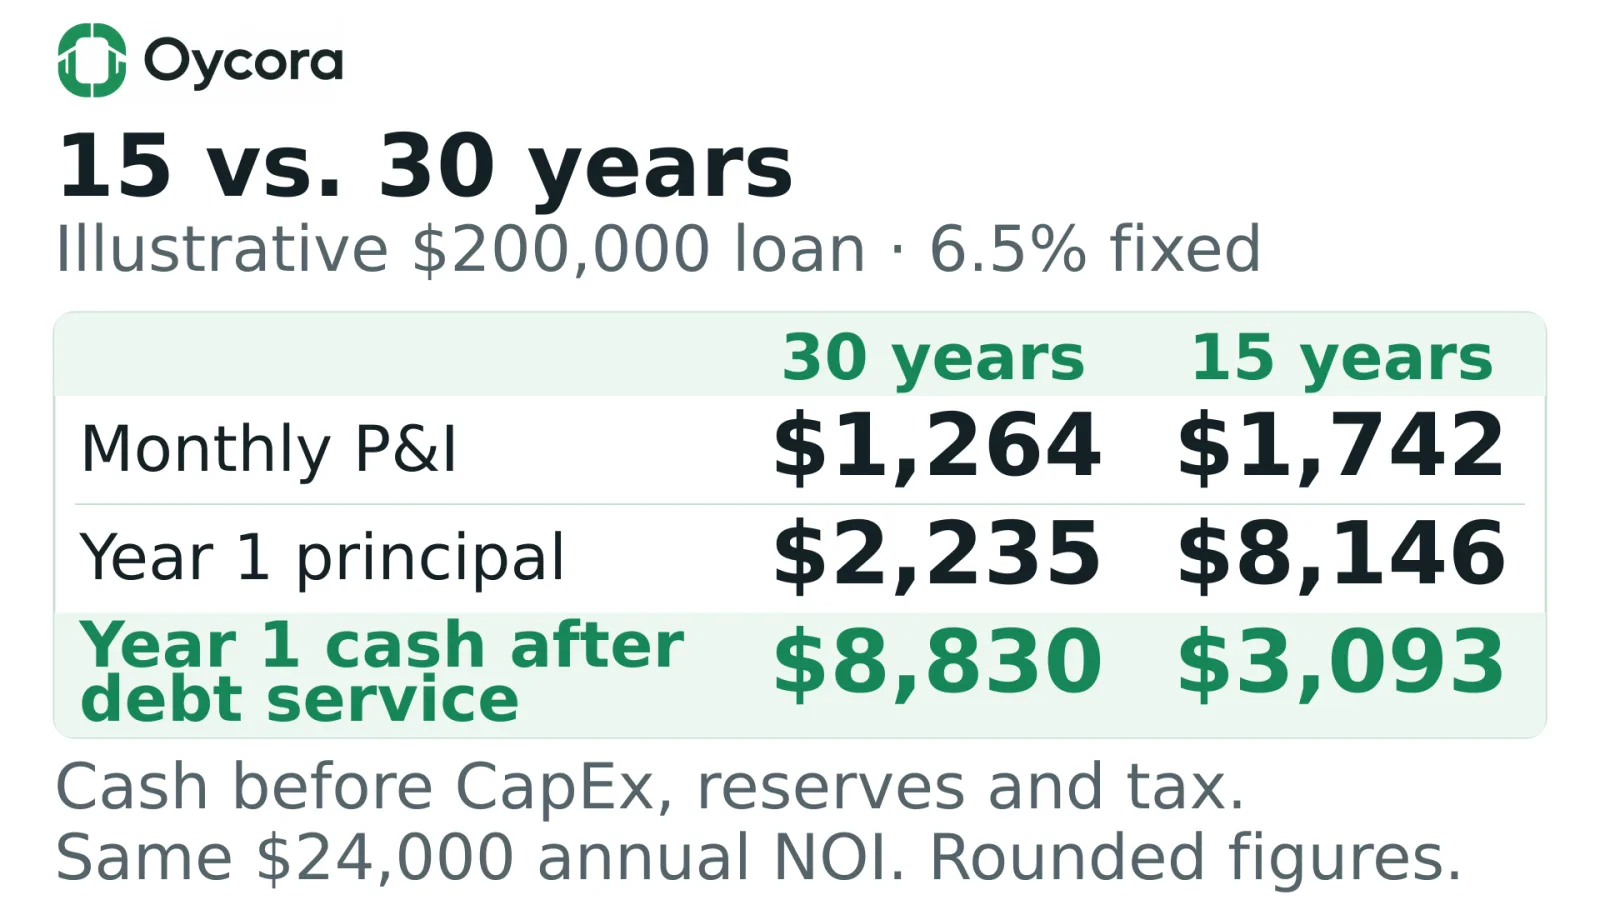
Now hold the initial loan amount, interest rate, property, and NOI constant, changing only the amortization period. Assume the rental produces $24,000 of annual NOI after vacancy and operating expenses. Both loans are fully amortizing, have monthly payments, and carry the same illustrative 6.5% rate so that the example isolates the effect of repayment speed.
Real loan offers may have different rates, fees, eligibility requirements, and maturities. The comparison deliberately excludes those differences. It also assumes no extra principal payments, no payment delays, and no changes to income or expenses during the first year. The cash figure is NOI less scheduled principal and interest, before capital expenditures, reserve transfers, and income tax.
Same Rental, Different Amortization Period
Fictional first-year comparison: $200,000 starting loan, fixed 6.5% illustrative interest rate, monthly payments, and $24,000 annual NOI. Figures rounded to the nearest dollar from an unrounded amortization schedule.
| Measure | 30-year loan | 15-year loan |
|---|---|---|
| Monthly principal and interest | $1,264 | $1,742 |
| Annual scheduled debt service | $15,170 | $20,907 |
| Principal repaid in year one | $2,235 | $8,146 |
| Interest paid in year one | $12,934 | $12,760 |
| Loan balance after year one | $197,765 | $191,854 |
| Cash after scheduled debt service | $8,830 | $3,093 |
Additional first-year principal repayment with the 15-year loan
About $5,911
$8,146.43 − $2,235.45 = $5,910.98
The shorter loan repays more principal but requires about $5,737 more in first-year payments. Cash after debt service is before CapEx, reserve transfers, and income tax. Rounded table rows may not add exactly.
The shorter loan repays about $5,911 more principal during year one, while requiring about $5,737 more in payments. The difference reflects approximately $174 less interest under the faster repayment schedule. These are two views of the same cash movements, not independent bonuses that can be freely added together.
The 30-year loan leaves more cash after scheduled debt service in this example. The 15-year loan reduces the debt more quickly. Neither result alone establishes which financing choice is suitable. The owner still needs to consider the property’s actual bills, required cash cushion, other commitments, and the consequences of a weaker rental year.
Why Equity Growth Is Different From Cash Flow
For a simple property with one mortgage, gross equity is its estimated market value minus the outstanding loan balance. Assume the fictional rental remains worth $250,000. Initial gross equity is $50,000. After one year, it becomes approximately $52,235 with the 30-year loan or $58,146 with the 15-year loan, solely because principal was repaid.
That equity is tied up in the property. Using it may require a sale or new borrowing, each subject to costs, market conditions, and other constraints. Gross equity also is not the same as net sale proceeds: selling costs, taxes, and other obligations can reduce what the owner actually receives. A higher equity figure cannot itself pay this month’s repair invoice.
Market value can also fall while the loan balance declines. If the same property were worth $240,000 after a year, gross equity under the 30-year scenario would be about $42,235 despite the principal repayment. Amortization improves the debt side of the equation; it does not guarantee rising property value or a positive overall return.
Avoid Counting Principal Repayment Twice
Principal repayment is a cash outflow that reduces a liability. It belongs in debt service when calculating money available after the loan payment. In a broader investment analysis, the resulting lower balance may contribute to equity or eventual sale proceeds. These roles are compatible, but they must be connected consistently.
A common mistake is to add all principal repaid during ownership to a projected return and also calculate sale proceeds using the already-reduced ending loan balance. The same debt reduction has then appeared twice. Choose a consistent model: trace annual cash movements and final net proceeds, or clearly separate the components of a return without duplicating them.
Similarly, cash-on-cash return normally focuses on pre-tax cash flow relative to cash invested; it does not treat noncash equity growth as a current distribution. Keep the calculation’s definition visible when comparing properties. A loan with faster amortization can reduce current cash-on-cash return even while it builds more equity through repayment.
Treat Extra Principal Payments as a Separate Decision
An extra payment applied to principal can reduce the balance sooner and lower future interest under a standard amortizing structure. It also uses cash that would otherwise remain available. Before making a decision, check how the servicer applies additional money, whether contractual restrictions or prepayment charges apply, and whether the regular required payment changes.
Do not assume that sending extra principal automatically lowers next month’s scheduled payment. A recast, refinance, or other contractual process may be needed to change that obligation. Ask the lender or servicer about the actual loan rather than projecting a lower payment from a smaller balance alone.
For an investor, the useful comparison includes liquidity as well as interest savings. An extra payment that leaves the operating account unable to cover a known bill creates a separate funding problem. Model the payment as an explicit use of cash and test the remaining cushion, rather than treating faster repayment as costless equity growth.
Use the Schedule Alongside a Property-Level Stress Test
Start with the actual loan amount, rate, amortization period, payment frequency, and maturity terms. Use the Rental Property Mortgage Calculator to examine the scheduled payment, then review the Loan Amortization and Projected Equity methodology so that the projection’s assumptions are clear. Compare the model with lender documents or the servicer’s schedule rather than relying on a rounded headline figure.
Next, use the Rental Property Cash Flow Calculator to test whether the required payments remain manageable if collected rent falls or operating costs rise. Keep property taxes and insurance counted once. The Rental Property ROI Calculator estimates a holding-period return from cash flow, principal paydown, and appreciation; it does not model a sale, selling costs, income taxes, or IRR. Analyze those separately before treating the estimate as a realized return.
Amortization is most useful when it makes the tradeoff visible: cash goes out now, some pays interest, and some reduces debt. A stronger analysis tracks both cash availability and the remaining balance through the intended holding period. The objective is a financing plan the property can support, not simply the fastest possible payoff. These illustrations are educational and are not individualized investment, lending, or tax advice.