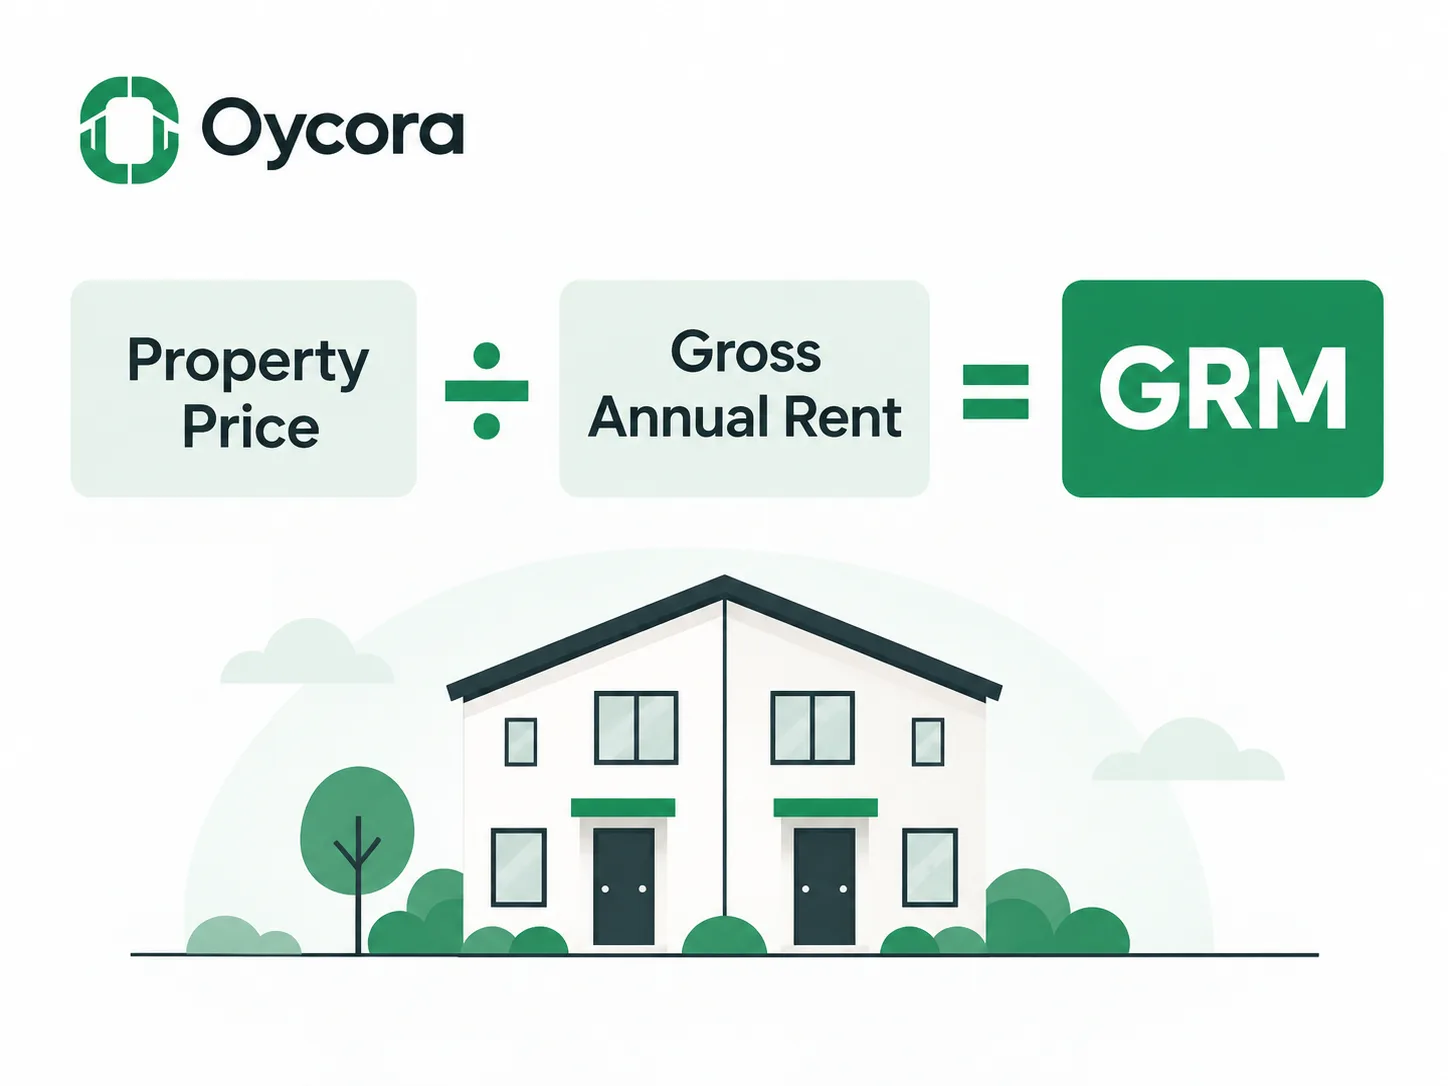
Gross rent multiplier, or GRM, is one of the simplest ways to compare the price of a rental property with the amount of gross rent it can produce. It requires only two inputs: the property's price or value and its annual rental income. That makes it useful when screening several properties quickly, especially before enough information is available to build a full analysis.
Its simplicity is also its biggest limitation. GRM ignores vacancy, operating expenses, financing, property condition, and most of the other factors that determine whether a rental actually performs well. It is best treated as a first-pass comparison metric, not as a substitute for NOI, cap rate, cash flow, or a complete rental-property analysis.
What Does Gross Rent Multiplier Measure?
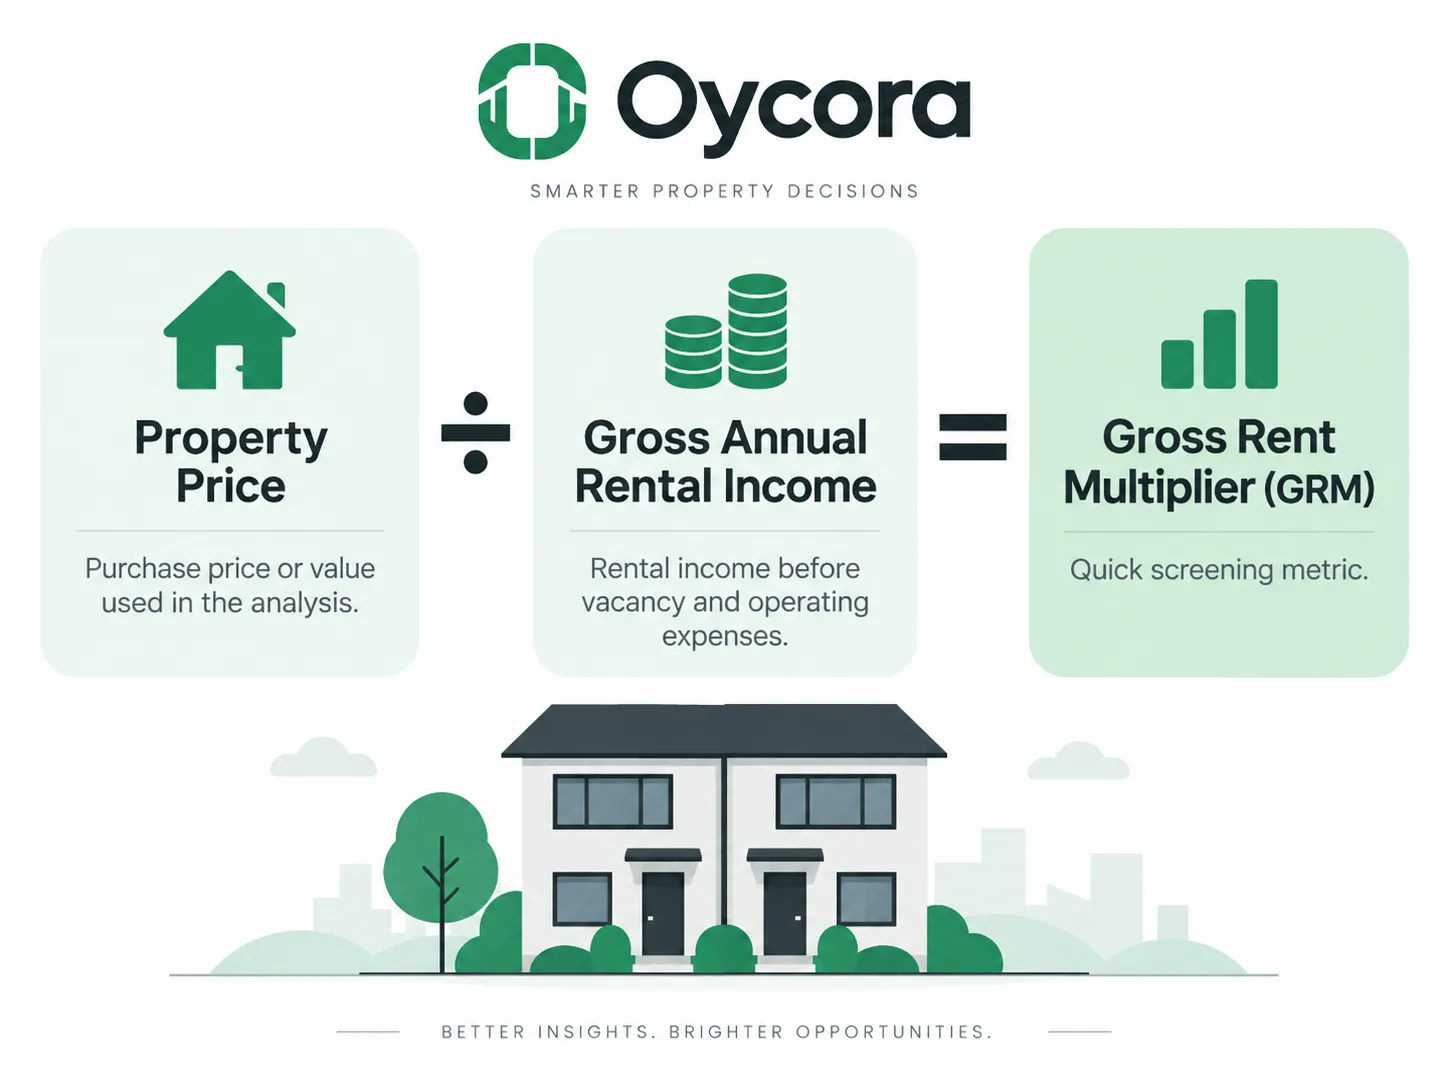
Gross rent multiplier compares a property's price with its gross annual rental income. The standard formula is:
GRM = Property Price ÷ Gross Annual Rental Income
If a property is priced at $240,000 and produces $30,000 in gross annual rent, its GRM is 8.0. In simple terms, the purchase price is eight times the property's annual gross rent. PropertyMetrics and Stessa both describe GRM as a quick comparison metric based on property price and gross rental income, while emphasizing that it leaves out expenses and other important parts of the investment.
A lower GRM generally means the property is priced lower relative to the rent it produces, while a higher GRM means the price is higher relative to that rent. That can be useful when comparing similar rentals in the same market, but the comparison only becomes meaningful when the income figures are calculated consistently.
What Counts as Gross Annual Rent?
GRM typically uses gross annual rental income, meaning the rent the property can produce before deducting vacancy, operating expenses, financing, or other costs. In many cases this means monthly rent multiplied by 12, or the combined annual rent from all units in a small multifamily property.
The important part is consistency. One property should not be calculated using current in-place rent while another uses an optimistic future market-rent projection unless that difference is deliberate and clearly understood. PropertyMetrics notes that GRM calculations can vary depending on whether actual rents, potential rents, trailing figures, or forward-looking projections are used, which is why comparison properties need to be calculated on the same basis.
GRM also differs from gross income multiplier, or GIM. GRM generally focuses specifically on rental income, while GIM may include additional property income such as parking, laundry, or other recurring revenue. Those metrics are sometimes used interchangeably even though the underlying calculations can differ.
Comparing Three Properties With GRM
Suppose an investor is screening three fictional rental properties in the same market before completing a deeper analysis.
| Property | Price | Gross Annual Rent | GRM |
|---|---|---|---|
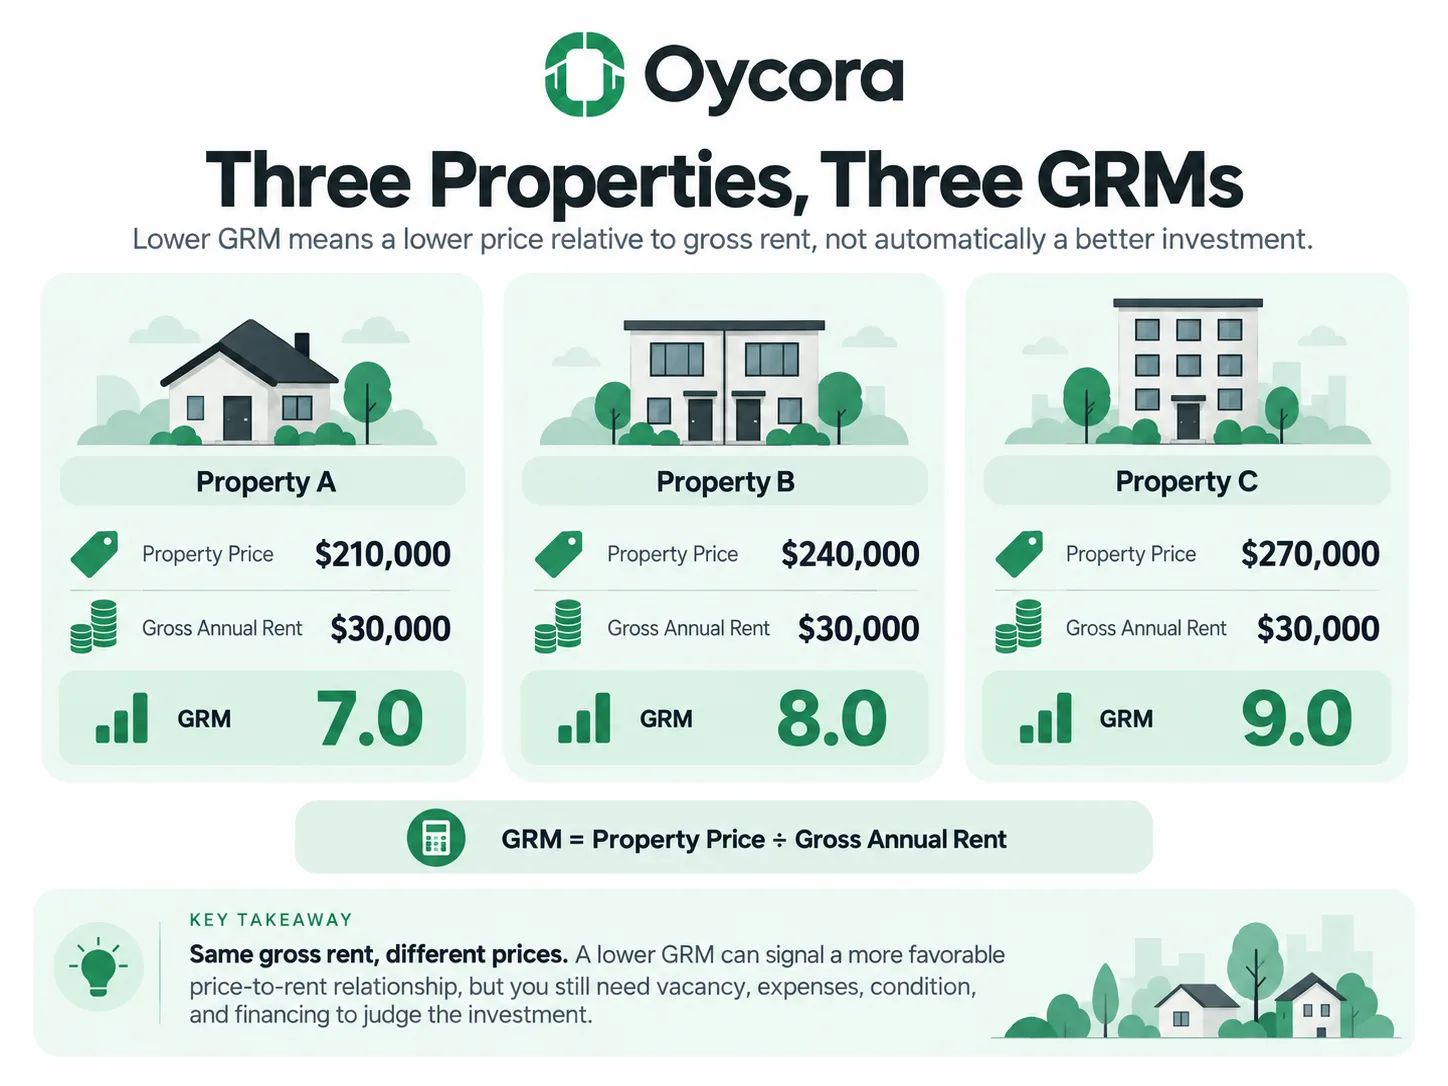
| Property A | $210,000 | $30,000 | 7.0 |
| Property B | $240,000 | $30,000 | 8.0 |
| Property C | $270,000 | $30,000 | 9.0 |
Property A has the lowest GRM because the same $30,000 of annual rent is being purchased for the lowest price. Property C has the highest because the investor is paying more for the same gross rent.
Now consider a different comparison:
| Property | Price | Gross Annual Rent | GRM |
|---|---|---|---|
| Property A | $240,000 | $34,000 | 7.06 |
| Property B | $240,000 | $30,000 | 8.00 |
| Property C | $240,000 | $26,000 | 9.23 |
Here the property price stays the same while the rent changes. The property producing more gross rent has the lower GRM.
The arithmetic is useful, but it still tells us nothing about taxes, insurance, maintenance, vacancy, property management, financing, or major repairs. A lower GRM may identify a property worth investigating, but it does not establish which property is actually the better investment.
Is a Lower GRM Better?
Everything else equal, a lower GRM means you are paying less for each dollar of gross rental income. That can make the property appear more attractive as an initial screen. If two genuinely similar rentals produce the same rent but one costs substantially less, the lower-priced property will naturally have the lower GRM.
The problem is that everything else is rarely equal. A lower-GRM property may have higher property taxes, expensive insurance, deferred maintenance, greater vacancy, weaker tenant demand, or large upcoming capital needs. Stessa specifically notes that a property with a lower GRM may still require more maintenance or significant capital repairs, which can erase the apparent advantage once expenses are considered.
That is why there is no universal GRM that automatically identifies a good rental property. PropertyMetrics recommends comparing GRMs among similar properties in the same market using consistent calculations rather than applying one “magic” threshold everywhere.
Why GRM Is Useful for Screening Properties
The biggest advantage of GRM is speed. Detailed rental analysis requires information about taxes, insurance, vacancy, management, maintenance, financing, reserves, and other inputs. GRM can be calculated with only a price and rent figure, which makes it useful when reviewing a large number of potential properties.
Imagine you are looking at 20 similar rentals. Running a complete analysis on every property before narrowing the list may be inefficient. GRM can help identify which ones are priced more favorably relative to gross rent, allowing the deeper analysis to focus on a smaller group.
That does not mean the properties with the lowest GRMs should automatically advance. The metric is more useful as a filter for further investigation than as a ranking system that decides which property wins.
What GRM Leaves Out
GRM does not account for operating expenses. Two properties may have identical prices and rents and therefore identical GRMs, while one pays twice as much in taxes and insurance. Once those expenses are deducted, their NOI and cash flow can look very different.
The metric also ignores vacancy. A property expected to produce $36,000 in gross rent may collect materially less if turnover is high or tenant demand is weak. GRM still treats the full gross-rent figure as though the income itself were the relevant comparison.
Financing is excluded as well. Down payment, interest rate, loan term, and debt service have no effect on GRM, which means it cannot tell you anything about investor-level cash flow or cash-on-cash return. PropertyMetrics describes this limitation clearly: without accounting for expenses, leverage, amortization, and other income sources, GRM cannot estimate the property's true investment return.
Property condition is another major omission. A newly renovated rental and a neglected property with the same price and gross rent produce the same GRM even though their expected repair costs may be completely different.
GRM vs. Cap Rate
GRM and cap rate both compare property economics with value, but cap rate goes one important step further.
GRM = Property Price ÷ Gross Annual Rent
Cap Rate = Net Operating Income ÷ Property Value
GRM uses gross rent before operating expenses. Cap rate uses NOI after vacancy and operating expenses have been considered. That makes cap rate more informative when reliable expense data is available, while GRM is faster when it is not.
Stessa makes the same distinction: GRM focuses on gross rental income, while cap rate uses NOI and therefore reflects operating expenses that GRM ignores.
This does not make GRM useless. It simply defines where it belongs in the process. GRM is a quick screening metric; cap rate belongs deeper in the property analysis.
GRM Can Also Be Used as a Rough Valuation Tool
If comparable properties in the same market tend to sell at similar GRMs, the metric can be rearranged to estimate a rough property value:
Property Value = Gross Annual Rent × Market GRM
Suppose similar local rentals are trading around an 8.0 GRM and a property produces $30,000 of gross annual rent. A rough income-based value estimate would be:
$30,000 × 8.0 = $240,000
PropertyMetrics describes this as one way GRM can be used to estimate value from comparable market transactions, while Stessa similarly characterizes GRM as a rough or “back-of-the-envelope” valuation approach.
The word rough matters. The estimate assumes that the subject property is genuinely comparable with the properties used to establish the market GRM. Differences in condition, expenses, location, tenant quality, unit mix, or other characteristics can justify very different values even when gross rent is similar.
Common GRM Mistakes
One common mistake is treating GRM as a return percentage. A GRM of 8 is not an 8% return. It is simply a multiplier showing that property value equals eight times the annual gross rent.
Another mistake is comparing properties using inconsistent rent assumptions. Using current rent for one property and aggressive future market rent for another can make the second property appear artificially attractive. A fair comparison requires the same income basis across each property being screened.
Investors may also assume that the lowest GRM automatically identifies the best deal. That ignores every cost GRM was intentionally designed to leave out. A low price relative to rent is worth investigating, but the next question should be why the property is priced that way.
Finally, GRM should not be used where a full analysis is already practical. Once taxes, insurance, vacancy, maintenance, management, financing, and other assumptions are available, there is little reason to let such a simplified metric dominate the decision.
Know When to Move Beyond GRM
Gross rent multiplier is valuable because it answers a narrow question quickly: How much am I paying for each dollar of gross annual rent?
That makes it useful when screening several similar rental properties, checking whether pricing appears unusual, or estimating a rough value from comparable properties. It requires very little data and takes only seconds to calculate.
But GRM does not tell you what the property actually earns after expenses, whether the loan works, how much cash flow remains, or whether the property has major capital needs. Those questions require a complete rental analysis.
Use GRM to decide which properties deserve a closer look. Once a property survives that first screen, move on to NOI, operating expenses, cap rate, cash flow, financing, reserves, and the rest of the numbers that determine how the investment actually performs.