
A rental property can lose some income and still cover its bills. The important question is how much income it can lose before the property no longer generates enough to cover its operating expenses and required debt payments. Break-even occupancy is designed to answer that question.
Instead of estimating how much vacancy you expect, break-even occupancy works backward from the property's costs. It calculates the percentage of potential rental income that must actually be collected for the property to cover operating expenses and debt service. The Office of the Comptroller of the Currency has used this same basic relationship in income-property lending analysis, describing the break-even ratio as operating expenses plus debt service divided by gross income.
That makes break-even occupancy especially useful as a risk metric. A property that can cover its modeled obligations at 75% occupancy has considerably more room for income loss than one that needs 95% occupancy just to break even.
What Does Break-Even Occupancy Measure?
The basic formula is:
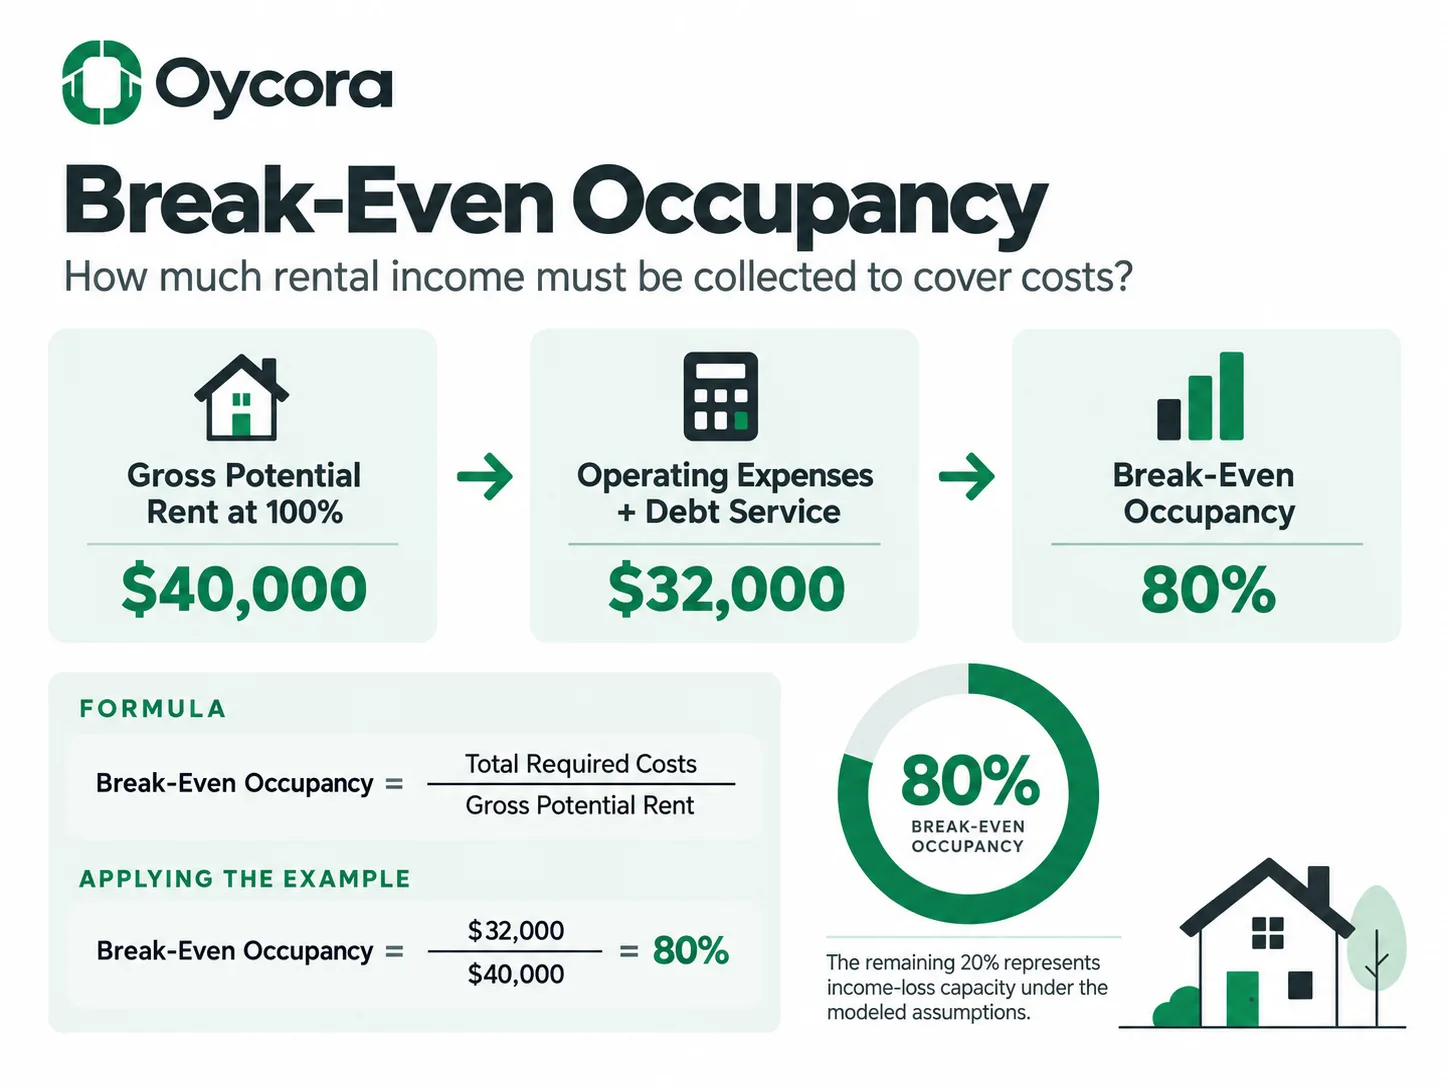
Break-Even Occupancy = (Operating Expenses + Annual Debt Service) ÷ Gross Potential Rental Income
Gross potential rental income represents the rent the property could produce at full occupancy before vacancy or collection loss. Operating expenses represent the recurring property costs included in the analysis, while annual debt service reflects the required principal and interest payments on the property's financing.
PropertyMetrics uses the same general formula and describes the result as the minimum occupancy needed to cover operating expenses and debt service. It also notes that real underwriting models may differ in how they handle ancillary income, replacement reserves, expense recoveries, or similar items, which is why methodology should remain consistent when properties are compared.
Suppose a rental has $40,000 of gross potential annual rent and $32,000 of combined operating expenses and debt service. Its break-even occupancy is 80%. In simple terms, the property needs to collect approximately 80% of its potential rent to cover the modeled obligations.
Break-Even Occupancy vs. Vacancy
Vacancy and break-even occupancy are related, but they look at the property from opposite directions. A vacancy assumption estimates how much rental income you expect to lose. Break-even occupancy estimates how much income the property needs to collect before it stops covering its modeled costs.
If a property has an 80% break-even occupancy, the corresponding theoretical income-loss cushion is about 20%. That does not necessarily mean the owner can comfortably experience 20% physical vacancy, because collection loss, timing, variable expenses, reserves, and other factors may affect the real result. It does mean that, within the assumptions used in the formula, there is more room between full potential income and the property's required cost level.
The OCC's historical underwriting example illustrates this clearly. A property with a 78% break-even ratio was described as having room for vacancy to rise substantially before the project experienced a loss, assuming the rest of the model remained unchanged.
That is what makes the metric useful alongside a normal vacancy assumption. If you expect 5% vacancy but the property breaks even at 95% occupancy, your expected vacancy is already close to the property's limit. If break-even occupancy is 70%, the modeled cushion is much wider.
What Makes Break-Even Occupancy Rise?
Break-even occupancy rises when the property's required costs become larger relative to its potential rent. Higher operating expenses, larger debt payments, or weaker potential rental income can all push the ratio upward.
Consider insurance. If annual premiums rise while rent remains unchanged, more of the property's full-income potential is required simply to cover costs. The same thing happens when taxes or maintenance increase. A property can therefore become more dependent on high occupancy even if the mortgage never changes.
Debt service can have an even larger effect because financing can create a substantial fixed obligation. A more leveraged purchase generally means a larger loan balance and potentially higher debt service, while a larger down payment can reduce that burden. The OCC has similarly noted that increasing loan size and loan payments reduces debt coverage when property income remains unchanged.
This is why break-even occupancy is partly a property metric and partly a financing metric. The same building can have a different break-even point under a different loan structure.
Same Property, Different Break-Even Points
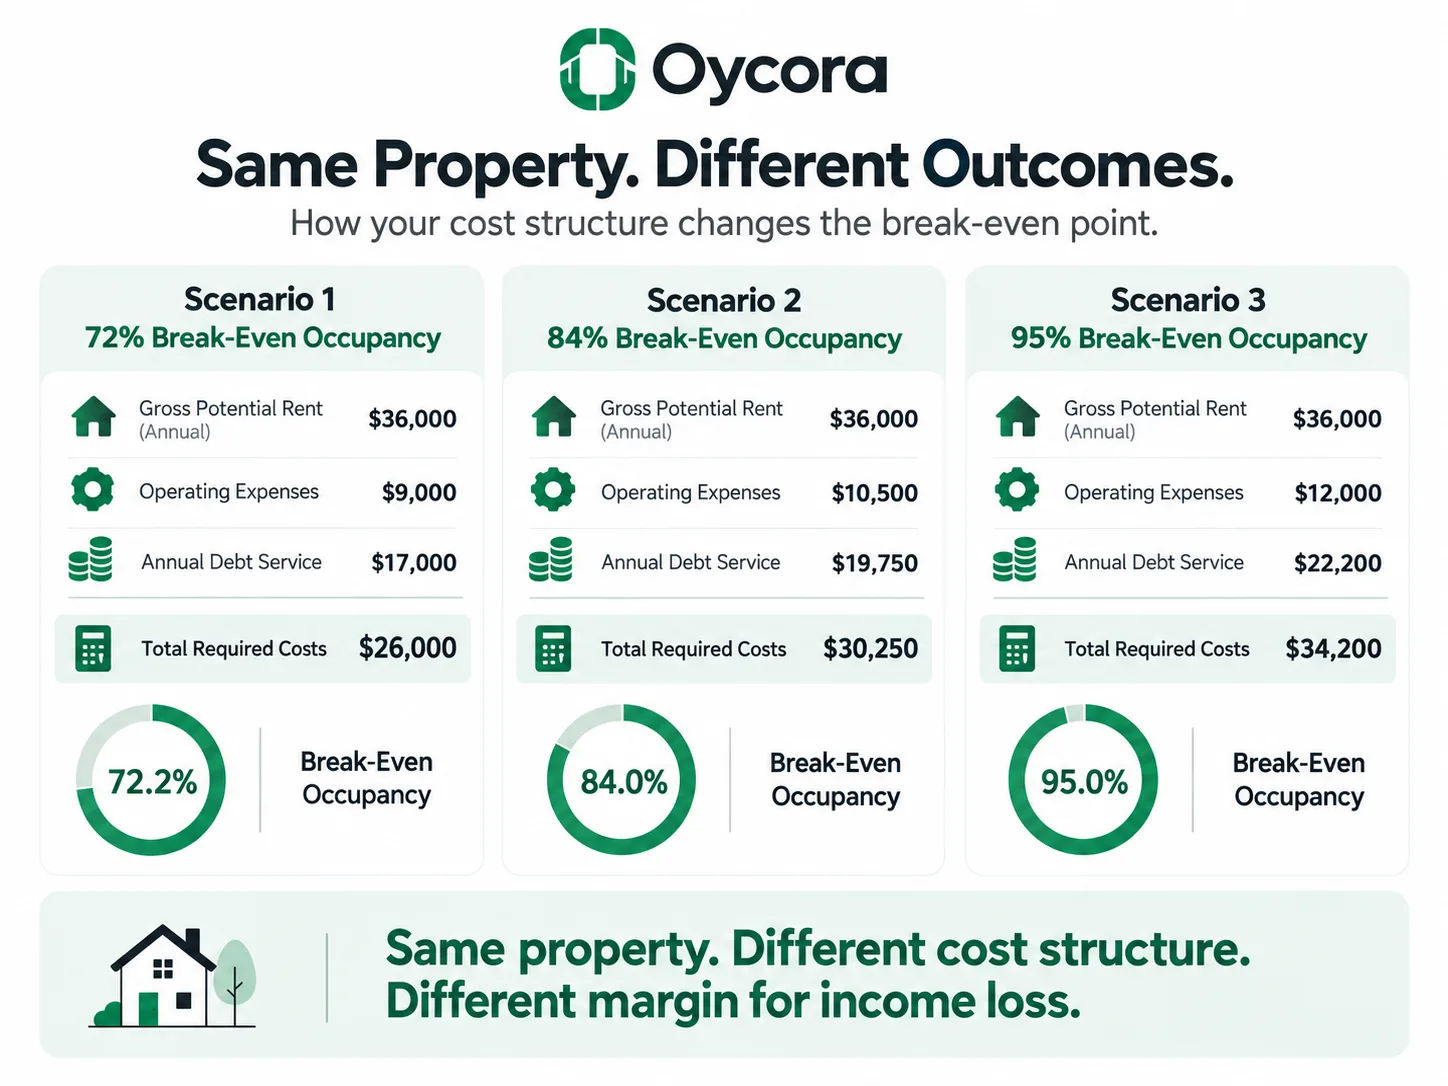
Assume a fictional rental property can generate $36,000 per year in gross potential rent. The property itself remains the same, but its operating and financing structure changes across three scenarios.
| Scenario | Operating Expenses | Annual Debt Service | Total Required Costs | Break-Even Occupancy |
|---|---|---|---|---|
| Lower-cost / lower-debt | $9,000 | $17,000 | $26,000 | 72.2% |
| Base case | $10,500 | $19,750 | $30,250 | 84.0% |
| Higher-cost / higher-debt | $12,000 | $22,200 | $34,200 | 95.0% |
The base case calculation is:
$30,250 ÷ $36,000 = 84.0%
That means the property needs to collect approximately 84% of its gross potential rental income to cover the operating expenses and debt service included in the model. The theoretical gap between full income and break-even is about 16%.
The 95% scenario is much tighter. Only about 5% of potential income can be lost before modeled costs are no longer fully covered. Nothing about the property's maximum rent changed; the higher costs and debt simply consumed more of its income capacity.
Is a Lower Break-Even Occupancy Better?
A lower break-even occupancy generally indicates more room for income loss before the property reaches the modeled break-even point. From a risk perspective, that additional cushion can be valuable because ordinary vacancy, collection problems, or rent reductions have farther to go before income falls below required costs.
That does not mean the lowest possible ratio should become a universal goal. A property with low break-even occupancy might require a very large down payment, which lowers debt service but ties up more investor capital. Another property may reasonably carry more leverage because the investor prefers to preserve cash even though the higher debt produces a tighter break-even point.
The ratio should therefore be interpreted alongside the financing strategy and the property's expected vacancy. PropertyMetrics makes the same contextual point: a break-even occupancy figure becomes more useful when compared with market vacancy and when its trend is evaluated over time rather than treated as an isolated good-or-bad threshold.
The useful question is not, “Is 80% good?”
It's, “How does 80% compare with the property's realistic occupancy expectations and risk profile?”
Break-Even Occupancy vs. DSCR
Break-even occupancy and debt service coverage ratio both help evaluate whether property income can support debt, but they frame the problem differently.
DSCR compares NOI with annual debt service. A DSCR above 1.00 indicates that the income measure used in the calculation exceeds debt service. Fannie Mae, for example, defines actual DSCR using underwritten NOI relative to annualized debt service.
Break-even occupancy instead asks how much of the property's full rental-income potential must be collected to cover both operating expenses and debt service. It therefore presents the same underlying risk in a way that is often easier to connect directly with vacancy.
A property may have a DSCR that appears adequate while still having a relatively high break-even occupancy because its operating expenses consume a large share of potential income. Looking at both metrics can provide a clearer view of how much flexibility exists if occupancy falls or expenses rise. BiggerPockets has similarly described break-even occupancy and DSCR as complementary ways to evaluate a property's margin of safety under lower occupancy.
Why High Leverage Can Tighten the Break-Even Point
Leverage is one of the easiest ways to move break-even occupancy without changing anything about the physical property. A larger loan typically creates higher required debt service. Because debt service sits in the numerator of the break-even formula, the occupancy needed to cover costs rises as the financing burden increases.
Suppose two investors purchase the same property. One makes a larger down payment and has $16,000 of annual debt service. The other uses more leverage and pays $22,000 annually. Their gross potential rent and operating expenses may be identical, but their break-even occupancy will not be.
This does not automatically make the lower-leverage structure better. More leverage can preserve cash and may affect cash-on-cash return differently. Break-even occupancy simply reveals one of the tradeoffs: more debt can make the property more dependent on consistently collecting rent.
That makes the ratio useful when comparing financing scenarios. A loan that produces attractive cash-on-cash return but pushes break-even occupancy close to the property's expected occupancy level deserves additional scrutiny.
Use Break-Even Occupancy for Stress Testing
The strongest use of break-even occupancy is not to calculate one percentage and stop. It is to see what happens when the assumptions move.
Increase insurance. Raise maintenance. Test a larger loan. Lower potential rent slightly. Each change affects the occupancy required to cover the property’s obligations. If a modest increase in costs pushes break-even occupancy from 82% to 94%, the property has a much thinner margin than the original base case suggested.
The metric can also be compared with the property's actual or expected occupancy. A property expected to operate around 96% occupancy has more apparent cushion against an 80% break-even point than against a 94% break-even point. The difference does not guarantee one property will perform better, but it makes the downside easier to see.
This is ultimately what break-even occupancy does best. It translates a complicated mix of expenses and financing into a straightforward question: how much of the property's potential rental income must be collected before the investment stops covering its modeled costs?
Used alongside vacancy, cash flow, and DSCR, that answer gives investors a clearer sense of how much room exists when the property does not perform exactly as planned.